CPU temperature in your menu bar.
And everything else.

A tiny, fast system monitor for Apple Silicon — temperature, CPU, memory, fan, GPU, battery, network, disk and power, exactly how you want them.

Launching soon · one-time $4.99 · macOS 14+ · Apple Silicon

ThermPort in the macOS menu bar showing temperature, CPU %, memory %, fan RPM and network speed
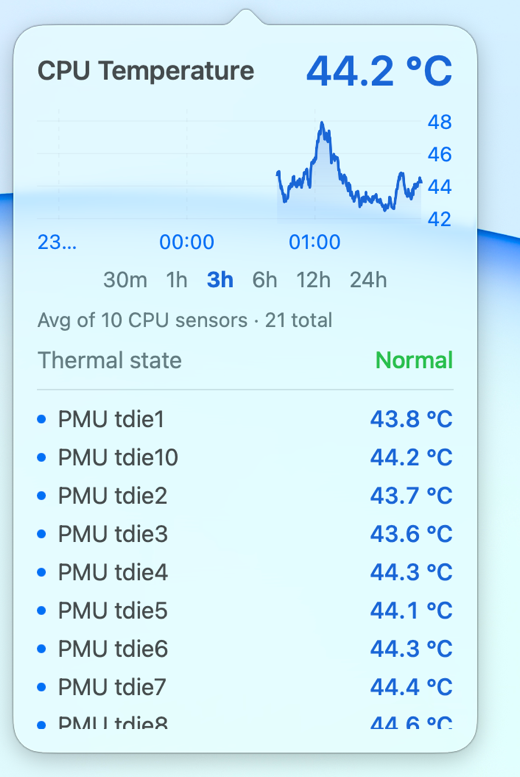
CPU Temperature detail panel with a live chart, every thermal sensor and the thermal state

Everything, at a glance

Pick which metrics show in the menu bar and in what order. Click any one for a detail panel with a live chart.

🌡️

CPU temperature

The thing most monitors can't put in the menu bar. Plus every thermal sensor and thermal-pressure state.

📊

10 metrics

CPU, memory, fan, GPU, battery, network, disk, power (watts) and Wi-Fi — each with history charts.

🎨

Your colors

Custom threshold color bands per metric, plus 15 one-tap palettes (Classic, Heat, Cyberpunk, Morandi…).

🔔

Alerts

Get a notification when temperature, CPU, memory or more crosses a threshold you set.

📄

Reports

Export PDF/HTML reports with metric curves and an activity analysis of what you were doing, when.

🌗

Made to fit in

Light/dark, adjustable size, 8 languages, and ~15 MB of memory. No daemons, no telemetry.

See it in action

Real screenshots — this is the actual app on Apple Silicon.

A live panel behind every metric

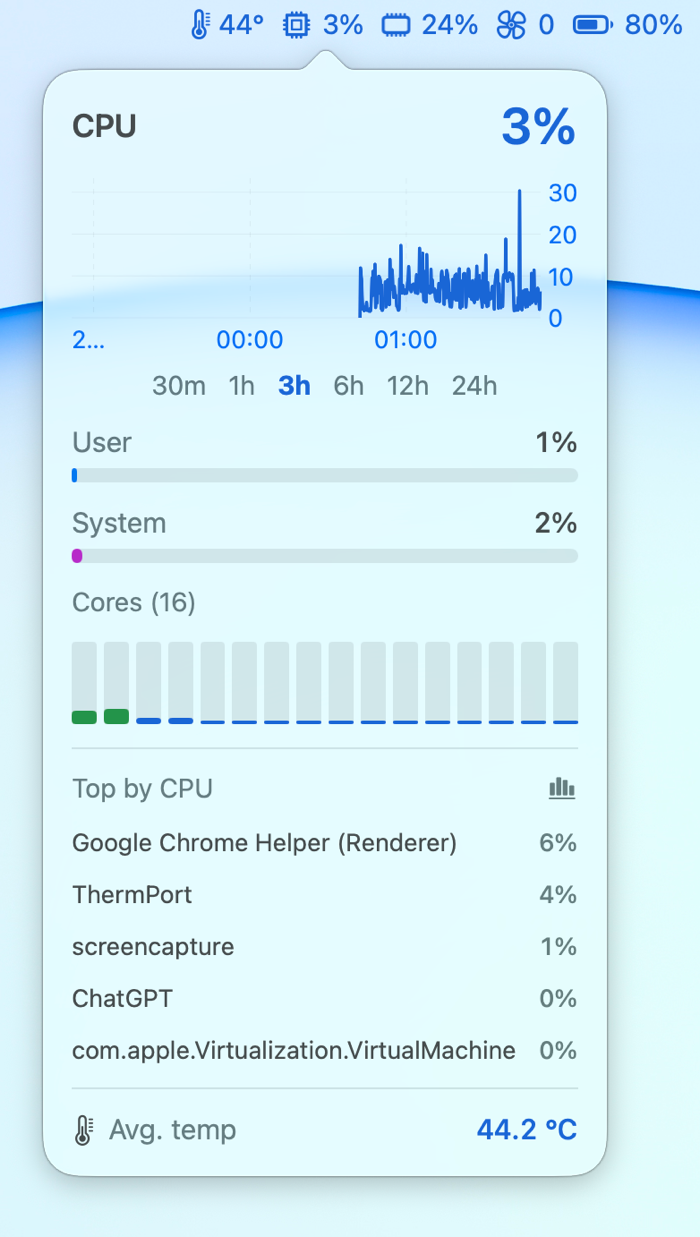
Click any menu-bar item for a full panel — a live history chart, a user/system split, a per-core grid, the top processes, and the average temperature, all in real time.

CPU detail panel: live usage chart, per-core grid, top processes and average temperature

Set it up your way

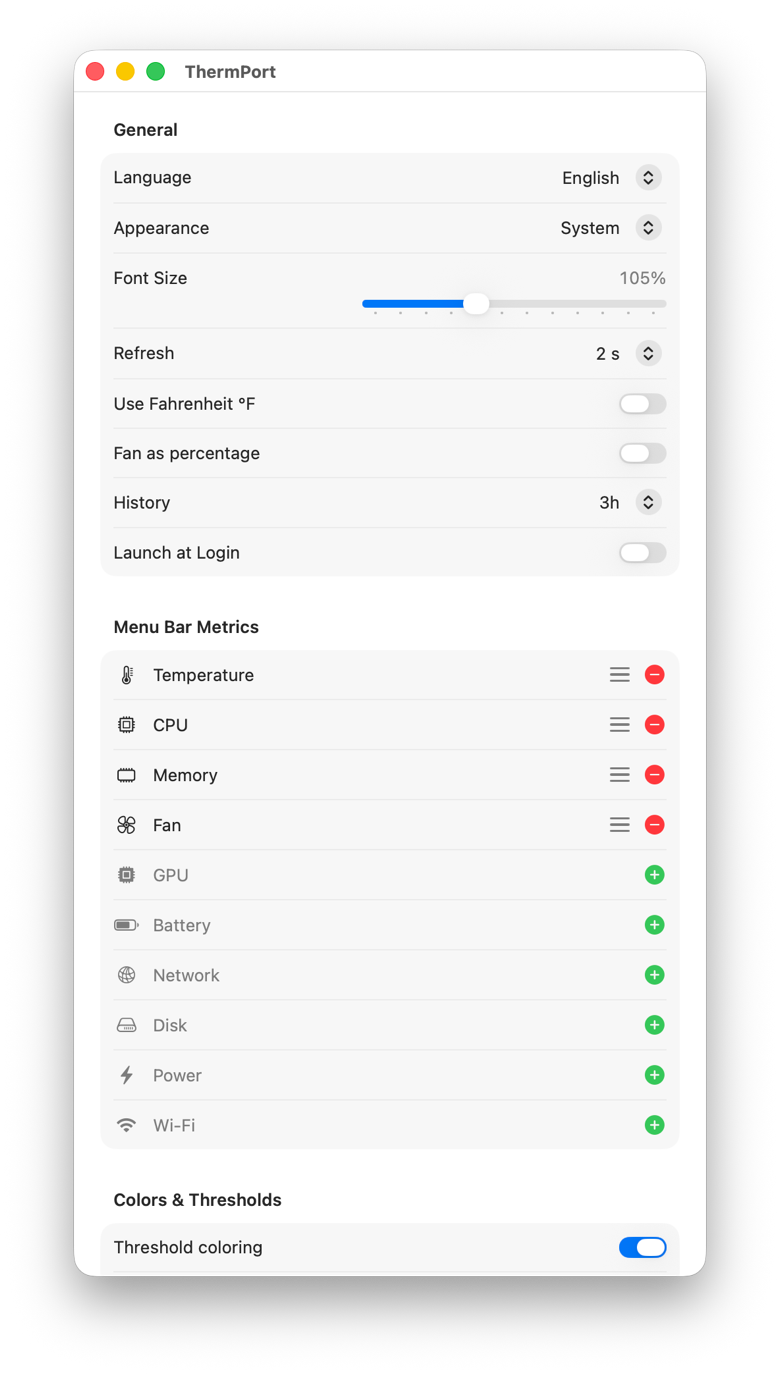
Choose exactly which metrics appear and in what order, °C or °F, the refresh rate, light/dark, font size, and launch at login — a couple of taps and it's yours.

ThermPort settings: General options and the drag-to-reorder Menu Bar Metrics list

Paint it your way

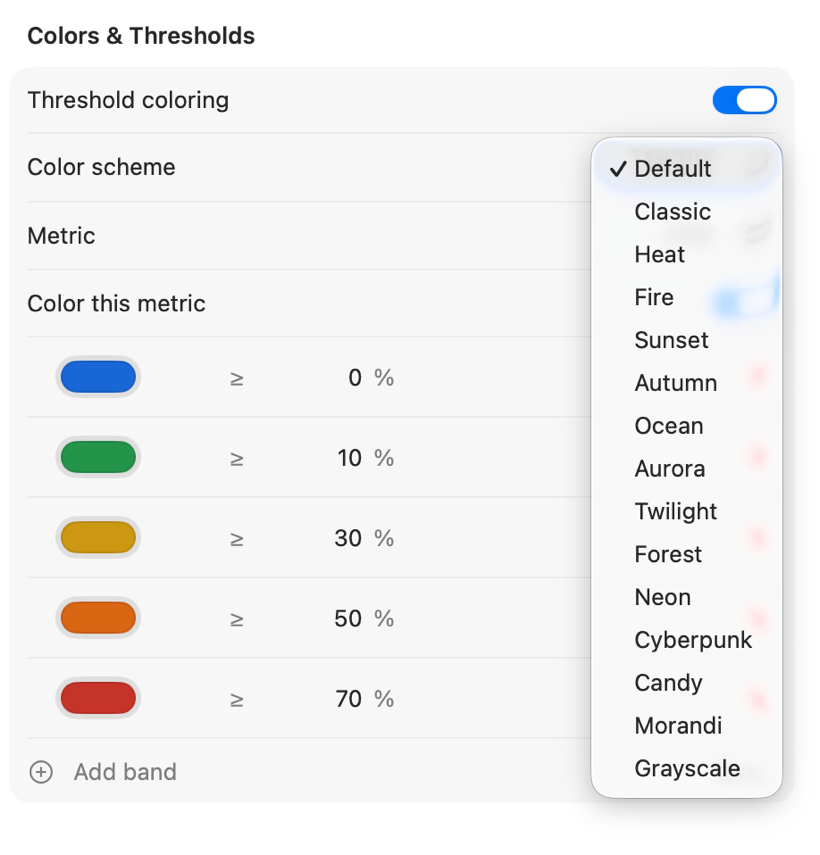
15 one-tap palettes — Default, Heat, Ocean, Cyberpunk, Morandi and more — or hand-set the threshold color bands per metric, so a hot CPU literally turns red.

Colors settings with the palette menu open, showing all 15 palettes and the color bands

Alerts & reports, built in

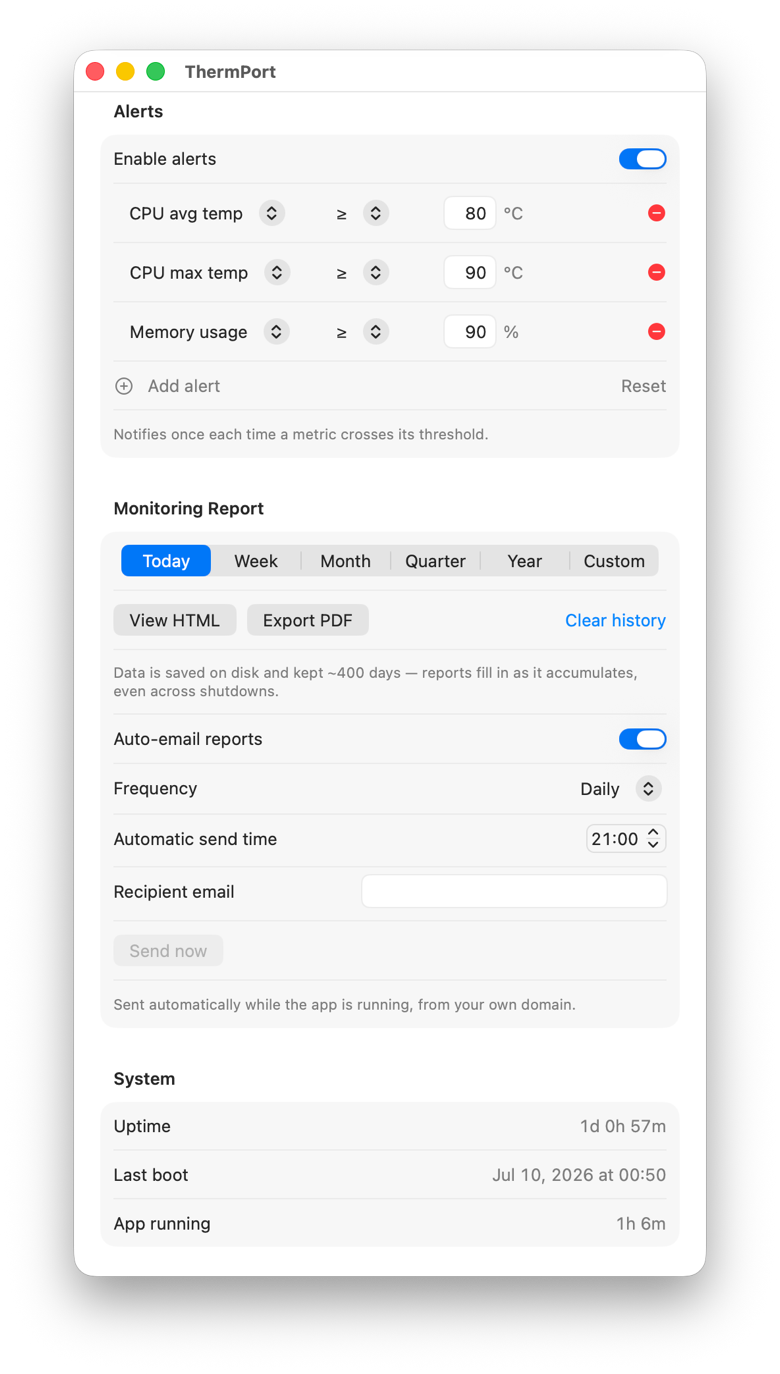
Get a native notification the moment a metric crosses a threshold you set — CPU ≥ 80°C, memory ≥ 90%, whatever you like — and pull a report for any period from the same screen.

Alerts rules plus the Monitoring Report controls and system info

Reports that explain your machine

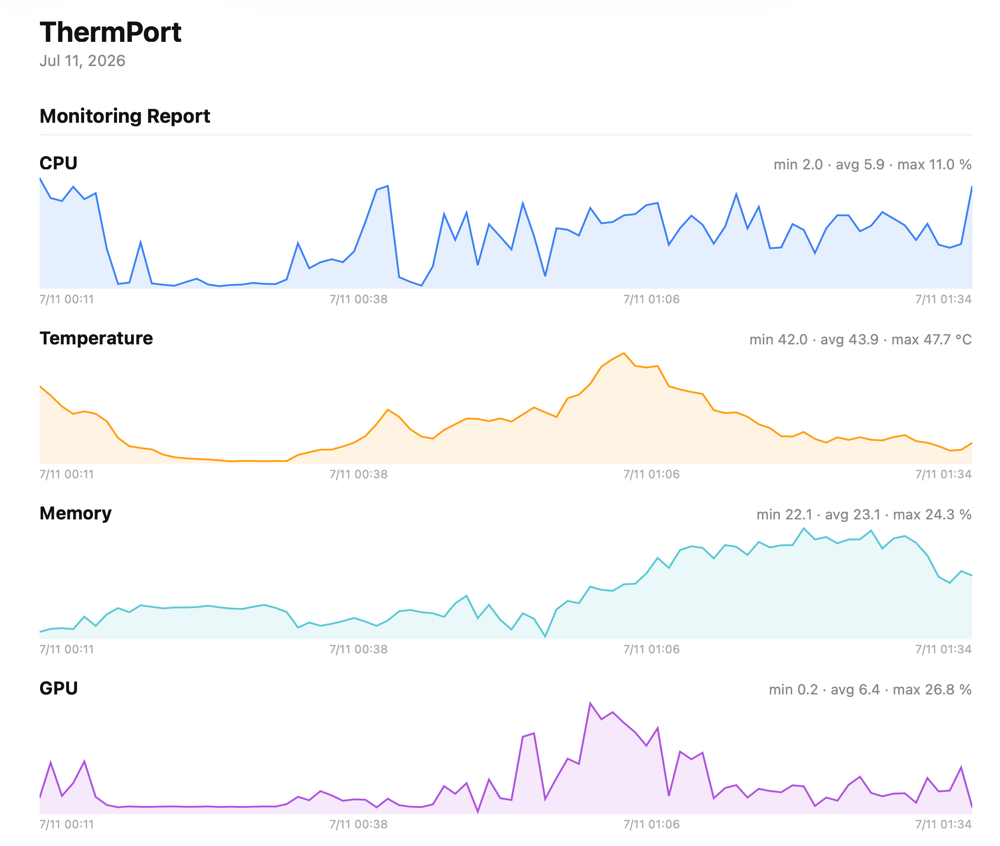
Export a PDF or HTML report for any period — day, week, month, quarter or year — with min / avg / max curves for every metric. Data is saved on disk and kept ~400 days.

A ThermPort report showing CPU, temperature, memory and GPU curves

…and what you were actually doing

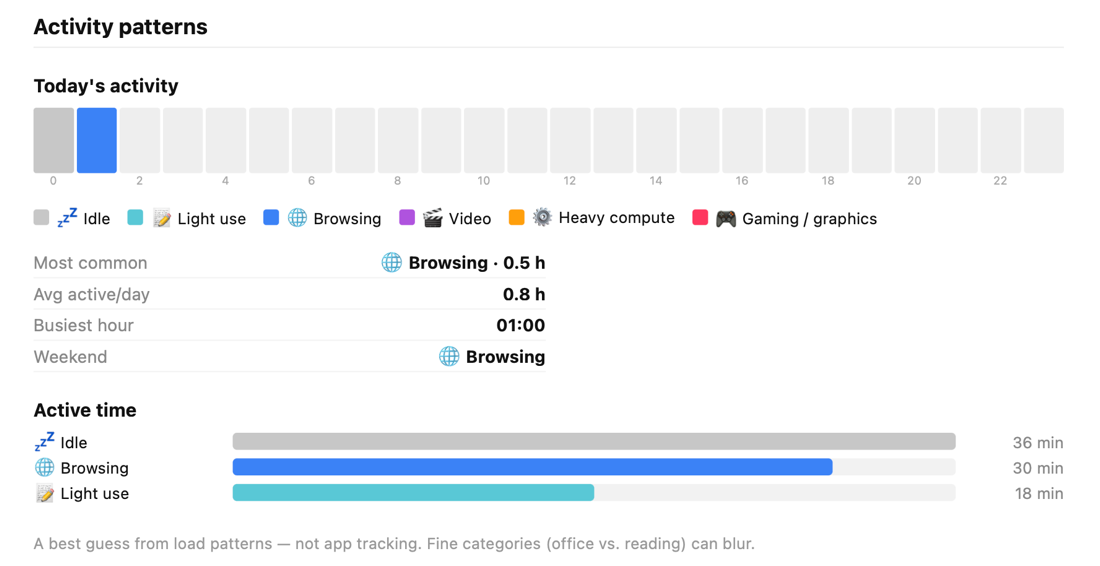
ThermPort infers activity from resource fingerprints — light use, browsing, video, heavy compute, gaming — and lays it out on a weekday × hour heatmap. A best guess, computed entirely on-device.

Activity patterns: a weekday-by-hour heatmap and a time-by-category breakdown

Launching soon

ThermPort is almost ready. Leave your email and I'll tell you the moment it's out.

$4.99
one-time · not a subscription
  • All metrics & detail panels
  • Custom colors, palettes & alerts
  • PDF / HTML reports
  • 8 languages, light & dark
  • Free 1.x updates
Email me at launch

One-time $4.99 · notarized download · no subscription

Requirements & opening the app. macOS 14 (Sonoma) or later, Apple Silicon (M-series). ThermPort is a notarized download (not from the Mac App Store, because reading temperature/fan/power needs Apple's private sensor APIs). After downloading, drag it to Applications and open it.